2.epidemilogic measures
•Download as PPT, PDF•
36 likes•16,622 views

The document defines key epidemiological measures used to describe disease occurrence and impact, including prevalence, incidence, rates, and ratios. It provides examples of how to calculate and interpret these measures. The document concludes that prevalence describes the current disease burden, while incidence provides information on the risk of developing disease over time and is thus better suited for etiological studies.
Report
Share


2.epidemilogic measures
- 1. Epidemiologic Measures CHEN Yu-ming 陈裕明 Prof., PhD Dept. Medical Statistics & Epidemiology Sun Yat-sen Univ.
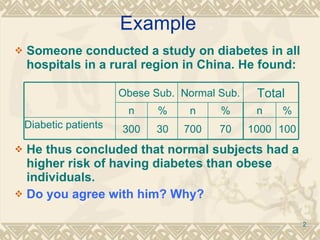
- 2. Example Someone conducted a study on diabetes in all hospitals in a rural region in China. He found: He thus concluded that normal subjects had a higher risk of having diabetes than obese individuals. Do you agree with him? Why? Obese Sub. Normal Sub. Total n % n % n % Diabetic patients 300 30 700 70 1000 100
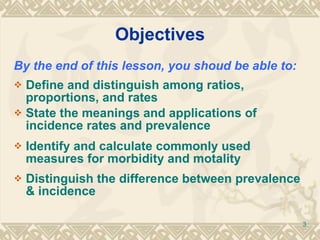
- 3. Objectives By the end of this lesson, you shoud be able to: Define and distinguish among ratios, proportions, and rates State the meanings and applications of incidence rates and prevalence Identify and calculate commonly used measures for morbidity and motality Distinguish the difference between prevalence & incidence
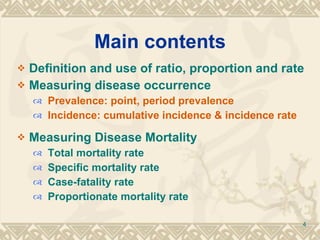
- 4. Main contents Definition and use of ratio, proportion and rate Measuring disease occurrence Prevalence: point, period prevalence Incidence: cumulative incidence & incidence rate Measuring Disease Mortality Total mortality rate Specific mortality rate Case-fatality rate Proportionate mortality rate
- 5. Definition and use of ratio, proportion and rate
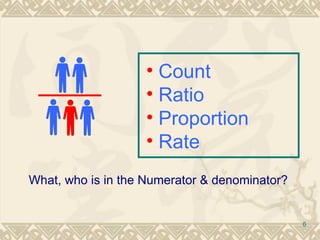
- 6. What, who is in the Numerator & denominator? Count Ratio Proportion Rate
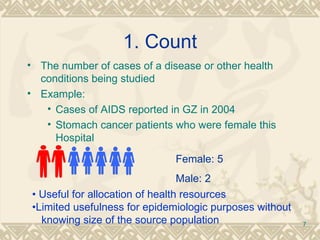
- 7. 1. Count The number of cases of a disease or other health conditions being studied Example: Cases of AIDS reported in GZ in 2004 Stomach cancer patients who were female this Hospital Female: 5 Male: 2 • Useful for allocation of health resources • Limited usefulness for epidemiologic purposes without knowing size of the source population
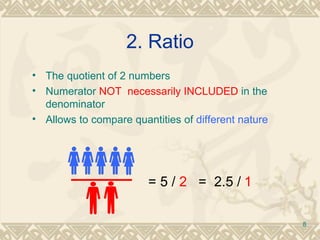
- 8. 2. Ratio The quotient of 2 numbers Numerator NOT necessarily INCLUDED in the denominator Allows to compare quantities of different nature = 5 / 2 = 2.5 / 1
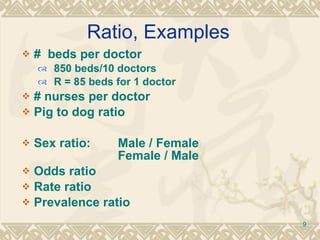
- 9. Ratio, Examples # beds per doctor 850 beds/10 doctors R = 85 beds for 1 doctor # nurses per doctor Pig to dog ratio Sex ratio: Male / Female Female / Male Odds ratio Rate ratio Prevalence ratio
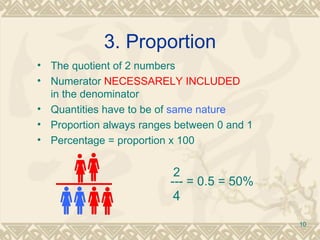
- 10. 3. Proportion 2 --- = 0.5 = 50% 4 The quotient of 2 numbers Numerator NECESSARELY INCLUDED in the denominator Quantities have to be of same nature Proportion always ranges between 0 and 1 Percentage = proportion x 100
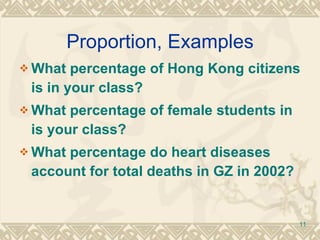
- 11. Proportion, Examples What percentage of Hong Kong citizens is in your class? What percentage of female students in is your class? What percentage do heart diseases account for total deaths in GZ in 2002?
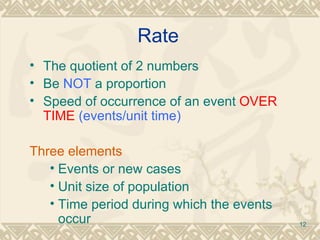
- 12. Rate The quotient of 2 numbers Be NOT a proportion Speed of occurrence of an event OVER TIME (events/unit time) Three elements Events or new cases Unit size of population Time period during which the events occur
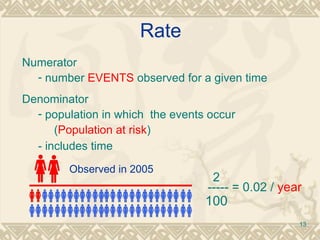
- 13. Rate Numerator number EVENTS observed for a given time Denominator population in which the events occur ( Population at risk ) - includes time 2 ----- = 0.02 / year 100 Observed in 2005
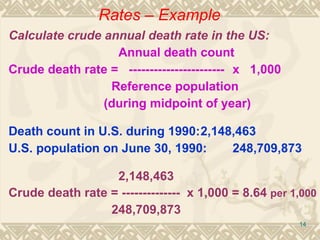
- 14. Calculate crude annual death rate in the US: Annual death count Crude death rate = ----------------------- x 1,000 Reference population (during midpoint of year) Death count in U.S. during 1990: 2,148,463 U.S. population on June 30, 1990: 248,709,873 2,148,463 Crude death rate = -------------- x 1,000 = 8.64 per 1,000 248,709,873 Rates – Example
- 15. Discussion Question What does a crude annual death rate of 8.64 per 1,000 mean?
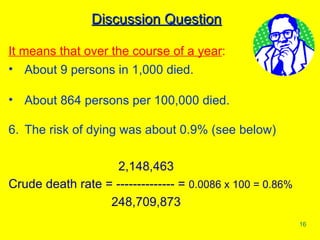
- 16. Discussion Question It means that over the course of a year : About 9 persons in 1,000 died. About 864 persons per 100,000 died. The risk of dying was about 0.9% (see below) 2,148,463 Crude death rate = -------------- = 0.0086 x 100 = 0.86% 248,709,873
- 17. Measuring the Occurrence of Disease Morbidity
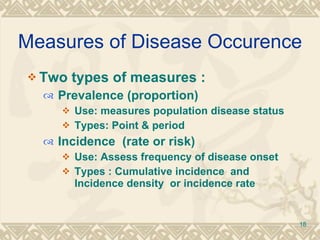
- 18. Measures of Disease Occurence Two types of measures : Prevalence (proportion) Use: measures population disease status Types: Point & period Incidence (rate or risk) Use: Assess frequency of disease onset Types : Cumulative incidence and Incidence density or incidence rate
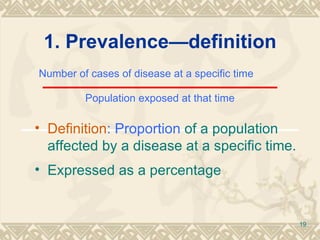
- 19. 1. Prevalence—definition Number of cases of disease at a specific time Population exposed at that time Definition : Proportion of a population affected by a disease at a specific time. Expressed as a percentage
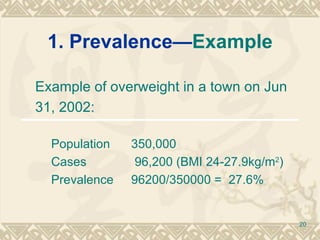
- 20. 1. Prevalence— Example Example of overweight in a town on Jun 31, 2002: Population 350,000 Cases 96,200 (BMI 24-27.9kg/m 2 ) Prevalence 96200/350000 = 27.6%
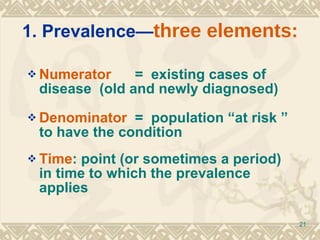
- 21. 1. Prevalence— three elements: Numerator = existing cases of disease (old and newly diagnosed) Denominator = population “at risk ” to have the condition Time : point (or sometimes a period) in time to which the prevalence applies
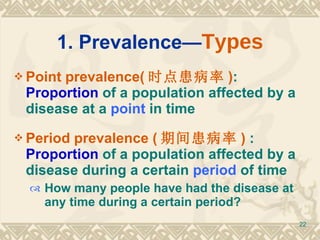
- 22. 1. Prevalence— Types Point prevalence( 时点患病率 ) : Proportion of a population affected by a disease at a point in time Period prevalence ( 期间患病率 ) : Proportion of a population affected by a disease during a certain period of time How many people have had the disease at any time during a certain period?
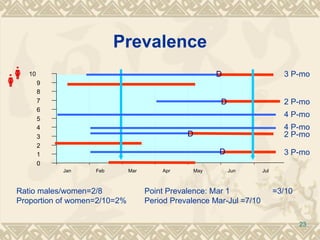
- 23. Prevalence Ratio males/women=2/8 Point Prevalence: Mar 1 =3/10 Proportion of women=2/10=2% Period Prevalence Mar-Jul =7/10 3 P-mo 3 P-mo 2 P-mo 4 P-mo 4 P-mo 2 P-mo D D D D 0 1 2 3 4 5 6 7 8 9 10 Jan Feb Mar Apr May Jun Jul
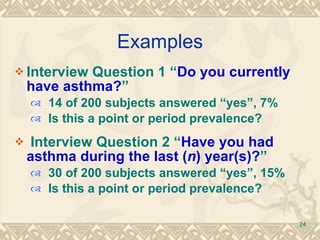
- 24. Examples Interview Question 1 “ Do you currently have asthma? ” 14 of 200 subjects answered “yes”, 7% Is this a point or period prevalence? Interview Question 2 “ Have you had asthma during the last ( n ) year(s)? ” 30 of 200 subjects answered “yes”, 15% Is this a point or period prevalence?
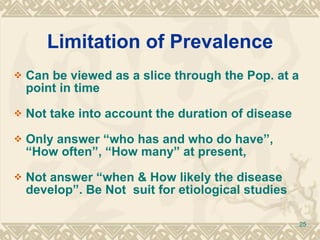
- 25. Limitation of Prevalence Can be viewed as a slice through the Pop. at a point in time Not take into account the duration of disease Only answer “who has and who do have”, “How often”, “How many” at present, Not answer “when & How likely the disease develop”. Be Not suit for etiological studies
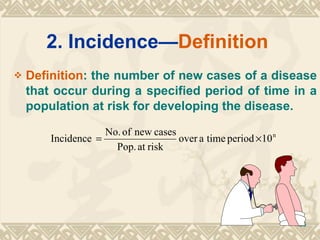
- 26. 2. Incidence— Definition Definition : the number of new cases of a disease that occur during a specified period of time in a population at risk for developing the disease.
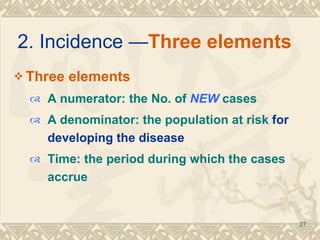
- 27. 2. Incidence — Three elements Three elements A numerator: the No. of NEW cases A denominator: the population at risk for developing the disease Time: the period during which the cases accrue
- 28. New case New onset, or Initial definitive diagnosis over the period of time
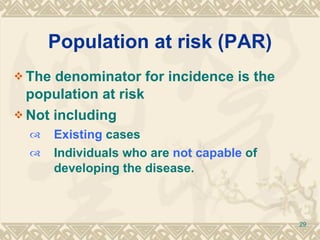
- 29. Population at risk (PAR) The denominator for incidence is the population at risk Not including Existing cases Individuals who are not capable of developing the disease.
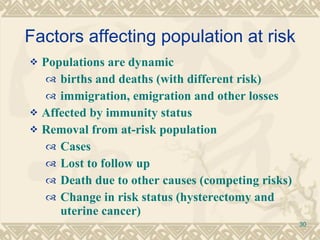
- 30. Factors affecting population at risk Populations are dynamic births and deaths (with different risk) immigration, emigration and other losses Affected by immunity status Removal from at-risk population Cases Lost to follow up Death due to other causes (competing risks) Change in risk status (hysterectomy and uterine cancer)
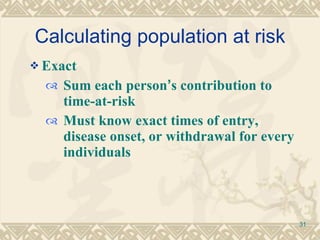
- 31. Calculating population at risk Exact Sum each person ’ s contribution to time-at-risk Must know exact times of entry, disease onset, or withdrawal for every individuals
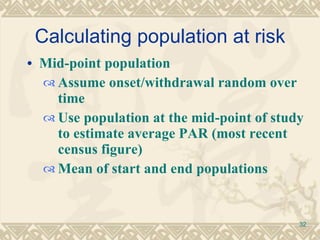
- 32. Calculating population at risk Mid-point population Assume onset/withdrawal random over time Use population at the mid-point of study to estimate average PAR (most recent census figure) Mean of start and end populations
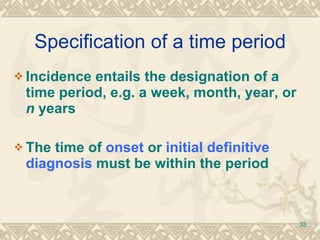
- 33. Specification of a time period Incidence entails the designation of a time period, e.g. a week, month, year, or n years The time of onset or initial definitive diagnosis must be within the period
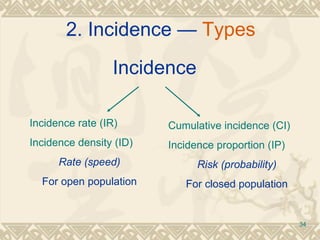
- 34. Incidence Incidence rate (IR) Incidence density (ID) Rate (speed) For open population Cumulative incidence (CI) Incidence proportion (IP) Risk (probability) For closed population 2. Incidence — Types
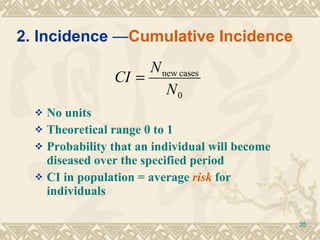
- 35. No units Theoretical range 0 to 1 Probability that an individual will become diseased over the specified period CI in population = average risk for individuals 2. Incidence — Cumulative Incidence
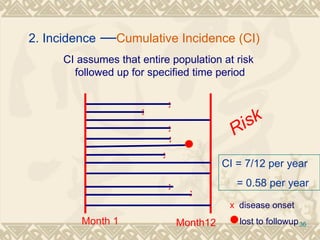
- 36. Risk CI assumes that entire population at risk followed up for specified time period x x x x x x x x disease onset lost to followup Month 1 Month12 CI = 7/12 per year = 0.58 per year 2. Incidence — Cumulative Incidence (CI)
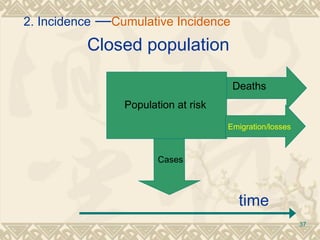
- 37. Closed population Population at risk Deaths Cases Emigration/losses time 2. Incidence — Cumulative Incidence
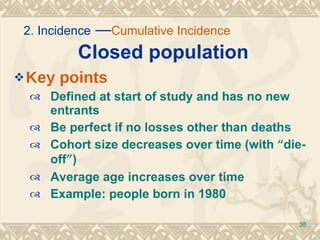
- 38. Closed population Key points Defined at start of study and has no new entrants Be perfect if no losses other than deaths Cohort size decreases over time (with “ die-off ” ) Average age increases over time Example: people born in 1980 2. Incidence — Cumulative Incidence
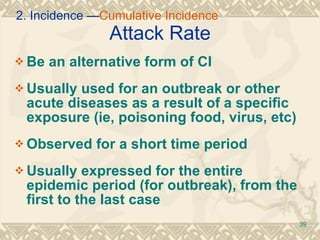
- 39. Attack Rate Be an alternative form of CI Usually used for an outbreak or other acute diseases as a result of a specific exposure (ie, poisoning food, virus, etc) Observed for a short time period Usually expressed for the entire epidemic period (for outbreak), from the first to the last case 2. Incidence — Cumulative Incidence
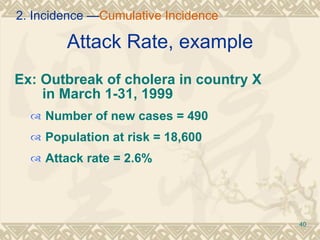
- 40. Attack Rate, example Ex: Outbreak of cholera in country X in March 1-31, 1999 Number of new cases = 490 Population at risk = 18,600 Attack rate = 2.6% 2. Incidence — Cumulative Incidence
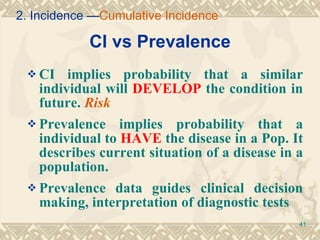
- 41. CI vs Prevalence CI implies probability that a similar individual will DEVELOP the condition in future. Risk Prevalence implies probability that a individual to HAVE the disease in a Pop. It describes current situation of a disease in a population. Prevalence data guides clinical decision making, interpretation of diagnostic tests 2. Incidence — Cumulative Incidence
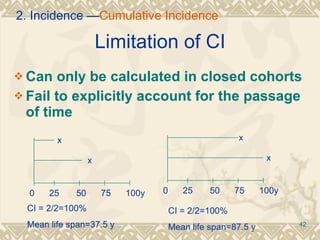
- 42. Limitation of CI Can only be calculated in closed cohorts Fail to explicitly account for the passage of time 0 25 50 75 100y x x 0 25 50 75 100y x x CI = 2/2=100% Mean life span=37.5 y CI = 2/2=100% Mean life span=87.5 y 2. Incidence — Cumulative Incidence
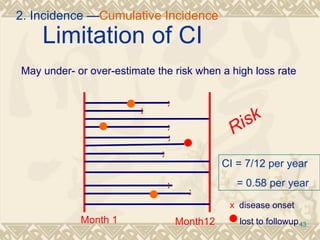
- 43. Limitation of CI Risk May under- or over-estimate the risk when a high loss rate x x x x x x x x disease onset lost to followup Month 1 Month12 CI = 7/12 per year = 0.58 per year 2. Incidence — Cumulative Incidence
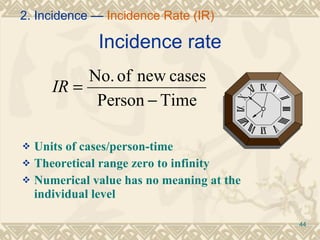
- 44. Incidence rate Units of cases/person-time Theoretical range zero to infinity Numerical value has no meaning at the individual level 2. Incidence — Incidence Rate (IR)
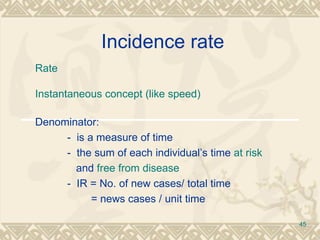
- 45. Incidence rate Rate Instantaneous concept (like speed) Denominator: - is a measure of time - the sum of each individual’s time at risk and free from disease - IR = No. of new cases/ total time = news cases / unit time
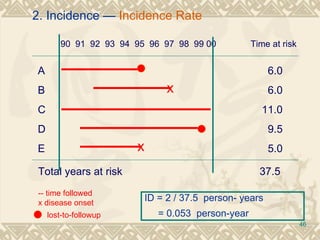
- 46. A B C D E 90 91 92 93 94 95 96 97 98 99 00 Time at risk x x 6.0 6.0 11.0 9.5 5.0 Total years at risk 37.5 -- time followed x disease onset lost-to-followup ID = 2 / 37.5 person- years = 0.053 person-year 2. Incidence — Incidence Rate
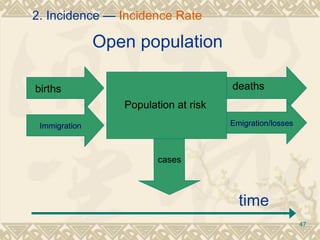
- 47. Open population Population at risk births deaths cases Immigration Emigration/losses time 2. Incidence — Incidence Rate
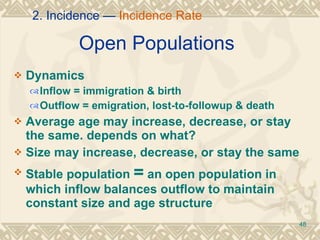
- 48. Open Populations Dynamics Inflow = immigration & birth Outflow = emigration, lost-to-followup & death Average age may increase, decrease, or stay the same. depends on what? Size may increase, decrease, or stay the same Stable population = an open population in which inflow balances outflow to maintain constant size and age structure 2. Incidence — Incidence Rate
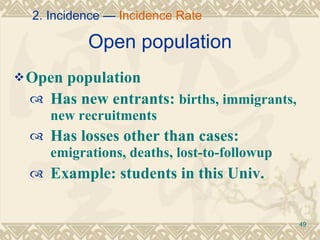
- 49. Open population Open population Has new entrants: births, immigrants, new recruitments Has losses other than cases: emigrations, deaths, lost-to-followup Example: students in this Univ. 2. Incidence — Incidence Rate
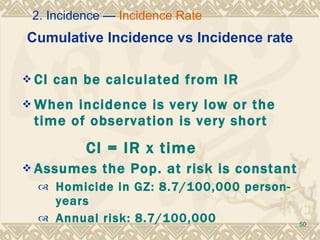
- 50. Cumulative Incidence vs Incidence rate CI can be calculated from IR When incidence is very low or the time of observation is very short CI = IR x time Assumes the Pop. at risk is constant Homicide in GZ: 8.7/100,000 person-years Annual risk: 8.7/100,000 2. Incidence — Incidence Rate
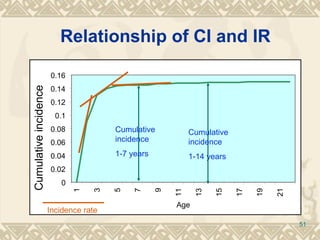
- 51. Relationship of CI and IR 0 0.02 0.04 0.06 0.08 0.1 0.12 0.14 0.16 1 3 5 7 9 11 13 15 17 19 21 Age Cumulative incidence Incidence rate Cumulative incidence 1-14 years Cumulative incidence 1-7 years
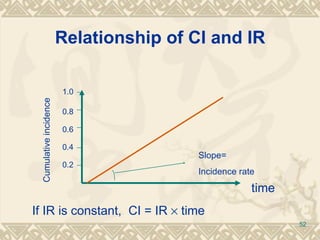
- 52. Relationship of CI and IR time Cumulative incidence 0.2 0.4 0.6 0.8 1.0 Slope= Incidence rate If IR is constant, CI = IR time
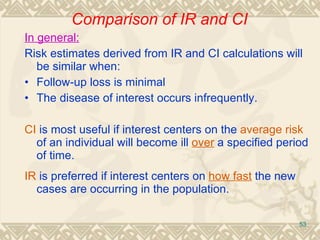
- 53. In general: Risk estimates derived from IR and CI calculations will be similar when: • Follow-up loss is minimal • The disease of interest o ccurs infrequently. CI is most useful if interest centers on the average risk of an individual will become ill over a specified period of time. IR is preferred if interest centers on how fast the new cases are occurring in the population. Comparison of IR and CI
- 54. Discussion Question How are incidence and prevalence of disease related?
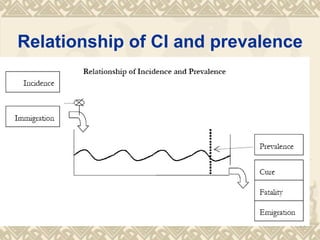
- 55. Relationship of CI and prevalence
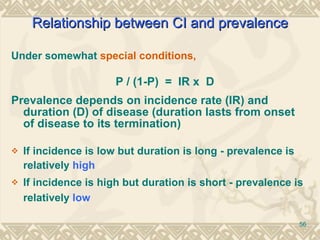
- 56. Under somewhat special conditions, P / (1-P) = IR x D Prevalence depends on incidence rate (IR) and duration (D) of disease (duration lasts from onset of disease to its termination) If incidence is low but duration is long - prevalence is relatively high If incidence is high but duration is short - prevalence is relatively low Relationship between CI and prevalence
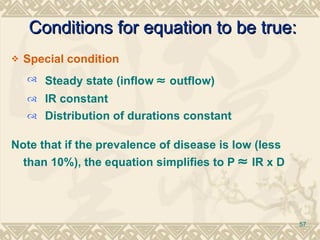
- 57. Special condition Steady state (inflow outflow) IR constant Distribution of durations constant Note that if the prevalence of disease is low (less than 10%), the equation simplifies to P IR x D Conditions for equation to be true:
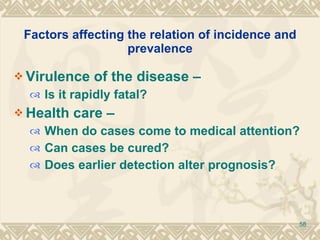
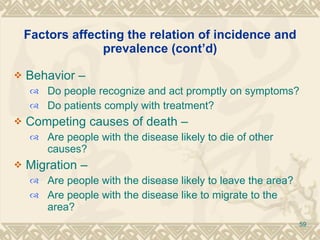
- 58. Factors affecting the relation of incidence and prevalence Virulence of the disease – Is it rapidly fatal? Health care – When do cases come to medical attention? Can cases be cured? Does earlier detection alter prognosis?
- 59. Factors affecting the relation of incidence and prevalence (cont’d) Behavior – Do people recognize and act promptly on symptoms? Do patients comply with treatment? Competing causes of death – Are people with the disease likely to die of other causes? Migration – Are people with the disease likely to leave the area? Are people with the disease like to migrate to the area?
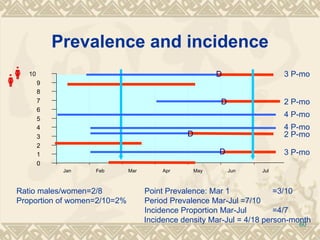
- 60. Prevalence and incidence Ratio males/women=2/8 Point Prevalence: Mar 1 =3/10 Proportion of women=2/10=2% Period Prevalence Mar-Jul =7/10 Incidence Proportion Mar-Jul =4/7 Incidence density Mar-Jul = 4/18 person-month 3 P-mo 3 P-mo 2 P-mo 4 P-mo 4 P-mo 2 P-mo D D D D 0 1 2 3 4 5 6 7 8 9 10 Jan Feb Mar Apr May Jun Jul
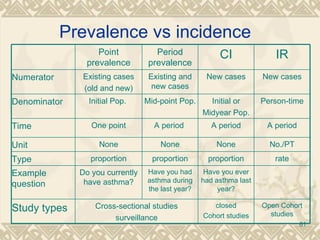
- 61. Prevalence vs incidence Point prevalence Period prevalence CI IR Numerator Existing cases (old and new) Existing and new cases New cases New cases Denominator Initial Pop. Mid-point Pop. Initial or Midyear Pop. Person-time Time One point A period A period A period Unit None None None No./PT Type proportion proportion proportion rate Example question Do you currently have asthma? Have you had asthma during the last year? Have you ever had asthma last year? Study types Cross-sectional studies surveillance closed Cohort studies Open Cohort studies
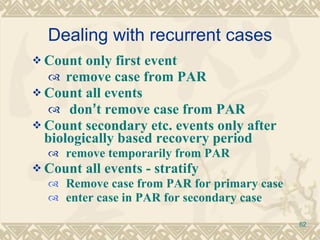
- 62. Dealing with recurrent cases Count only first event remove case from PAR Count all events don ’ t remove case from PAR Count secondary etc. events only after biologically based recovery period remove temporarily from PAR Count all events - stratify Remove case from PAR for primary case enter case in PAR for secondary case
- 63. Uses of Incidence & Prevalence Measures Prevalence: Snap shot of disease or health event Help health care providers plan to deliver services Indicate groups of people who should be targeted for control measures May signal etiologic relationships, but also reflects determinants of survival
- 64. Uses of Incidence & Prevalence Measures Incidence: Measure of choice to: --- Estimate risk of disease development --- Study etiological factors --- Evaluate primary prevention programs
- 65. Discussion Question Why is incidence preferred over prevalence when studying the etiology of disease?
- 66. Because, in the formula: P = I x D D is related to : - The subject’s constitution - Access to care - Availability of treatment - Social support - The severity of disease Discussion Question
- 67. So prevalent cases reflect factors related to the incidence of disease (Etiological factors), AND factors related to the duration of disease (Prognostic factors) Thus, they are not adequate for studies trying to elucidate Disease Etiology Discussion Question
- 68. Summary of Incidence and Prevalence PREVALENCE: Estimates the risk (probability) that an individual will BE ill at a point in time very useful to plan for health-related services and programs
- 69. INCIDENCE: - Estimates the risk (probability) of developing illness - Measures the change from “healthy” status to illness. Useful to evaluate prevention programs Useful to forecast need for services & programs Useful for studying causal factors.
- 70. Measuring the disease occurrence Mortality
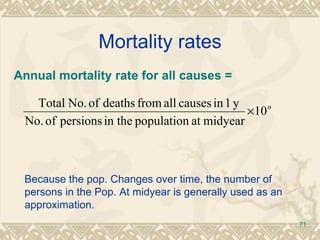
- 71. Mortality rates Annual mortality rate for all causes = Because the pop. Changes over time, the number of persons in the Pop. At midyear is generally used as an approximation.
- 72. Mortality rates Is mortality rate a risk or rate? Application An indication of risk of death of a population, health status, or healthcare level Evaluation of a intervention of measure
- 73. Specific Mortality Rates Population-specified rate Age-specified rate Sex-specified rate Job, race, country, … … Cause-specified rate Lung cancer mortality rate Heart disease mortality rate … …
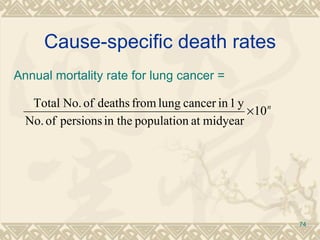
- 74. Cause-specific death rates Annual mortality rate for lung cancer =
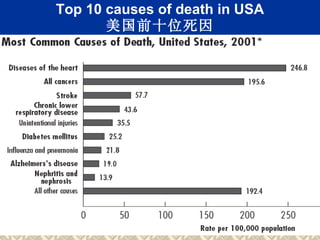
- 75. Top 10 causes of death in USA 美国前十位死因
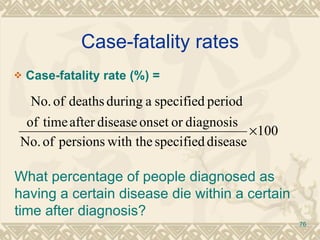
- 76. Case-fatality rates Case-fatality rate (%) = What percentage of people diagnosed as having a certain disease die within a certain time after diagnosis?
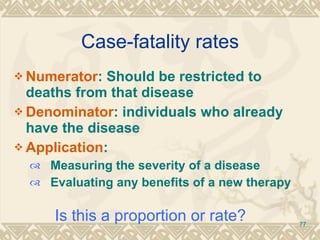
- 77. Case-fatality rates Numerator : Should be restricted to deaths from that disease Denominator : individuals who already have the disease Application : Measuring the severity of a disease Evaluating any benefits of a new therapy Is this a proportion or rate?
- 78. Survival rate Survival rate = 1- case-fatality rate
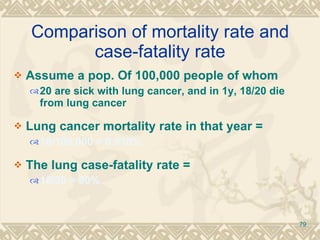
- 79. Comparison of mortality rate and case-fatality rate Assume a pop. Of 100,000 people of whom 20 are sick with lung cancer, and in 1y, 18/20 die from lung cancer Lung cancer mortality rate in that year = 18/100,000 = 0.018% The lung case-fatality rate = 18/20 = 90%
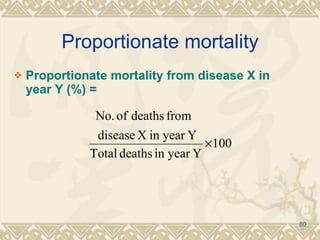
- 80. Proportionate mortality Proportionate mortality from disease X in year Y (%) =
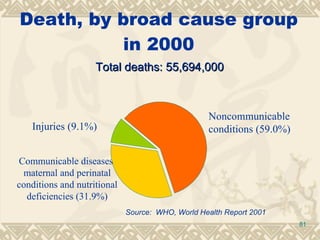
- 81. Death, by broad cause group in 2000 Injuries (9.1%) Noncommunicable conditions (59. 0 %) Communicable diseases, maternal and perinatal conditions and nutritional deficiencies (31. 9 %) Total deaths: 55,694,000 Source: WHO, World Health Report 200 1
- 82. References Greenberg RS, et al. Medical Epidemiology (4th ed.) Medical Publishing Division, Lange Medical Books/McGraw-Hill, New York. 2005 Gordis L. Epidemiology (3rd Ed.) Elsevier Inc. (USA), 2004 Friis RH & Sellers TA. Epidemiology for public health practice. Jones & Bartlett Publishers, Sudbruy, Massachusetts. 2004
- 83. Thanks!